外掛說明
Full featured analytics for WordPress APIs.
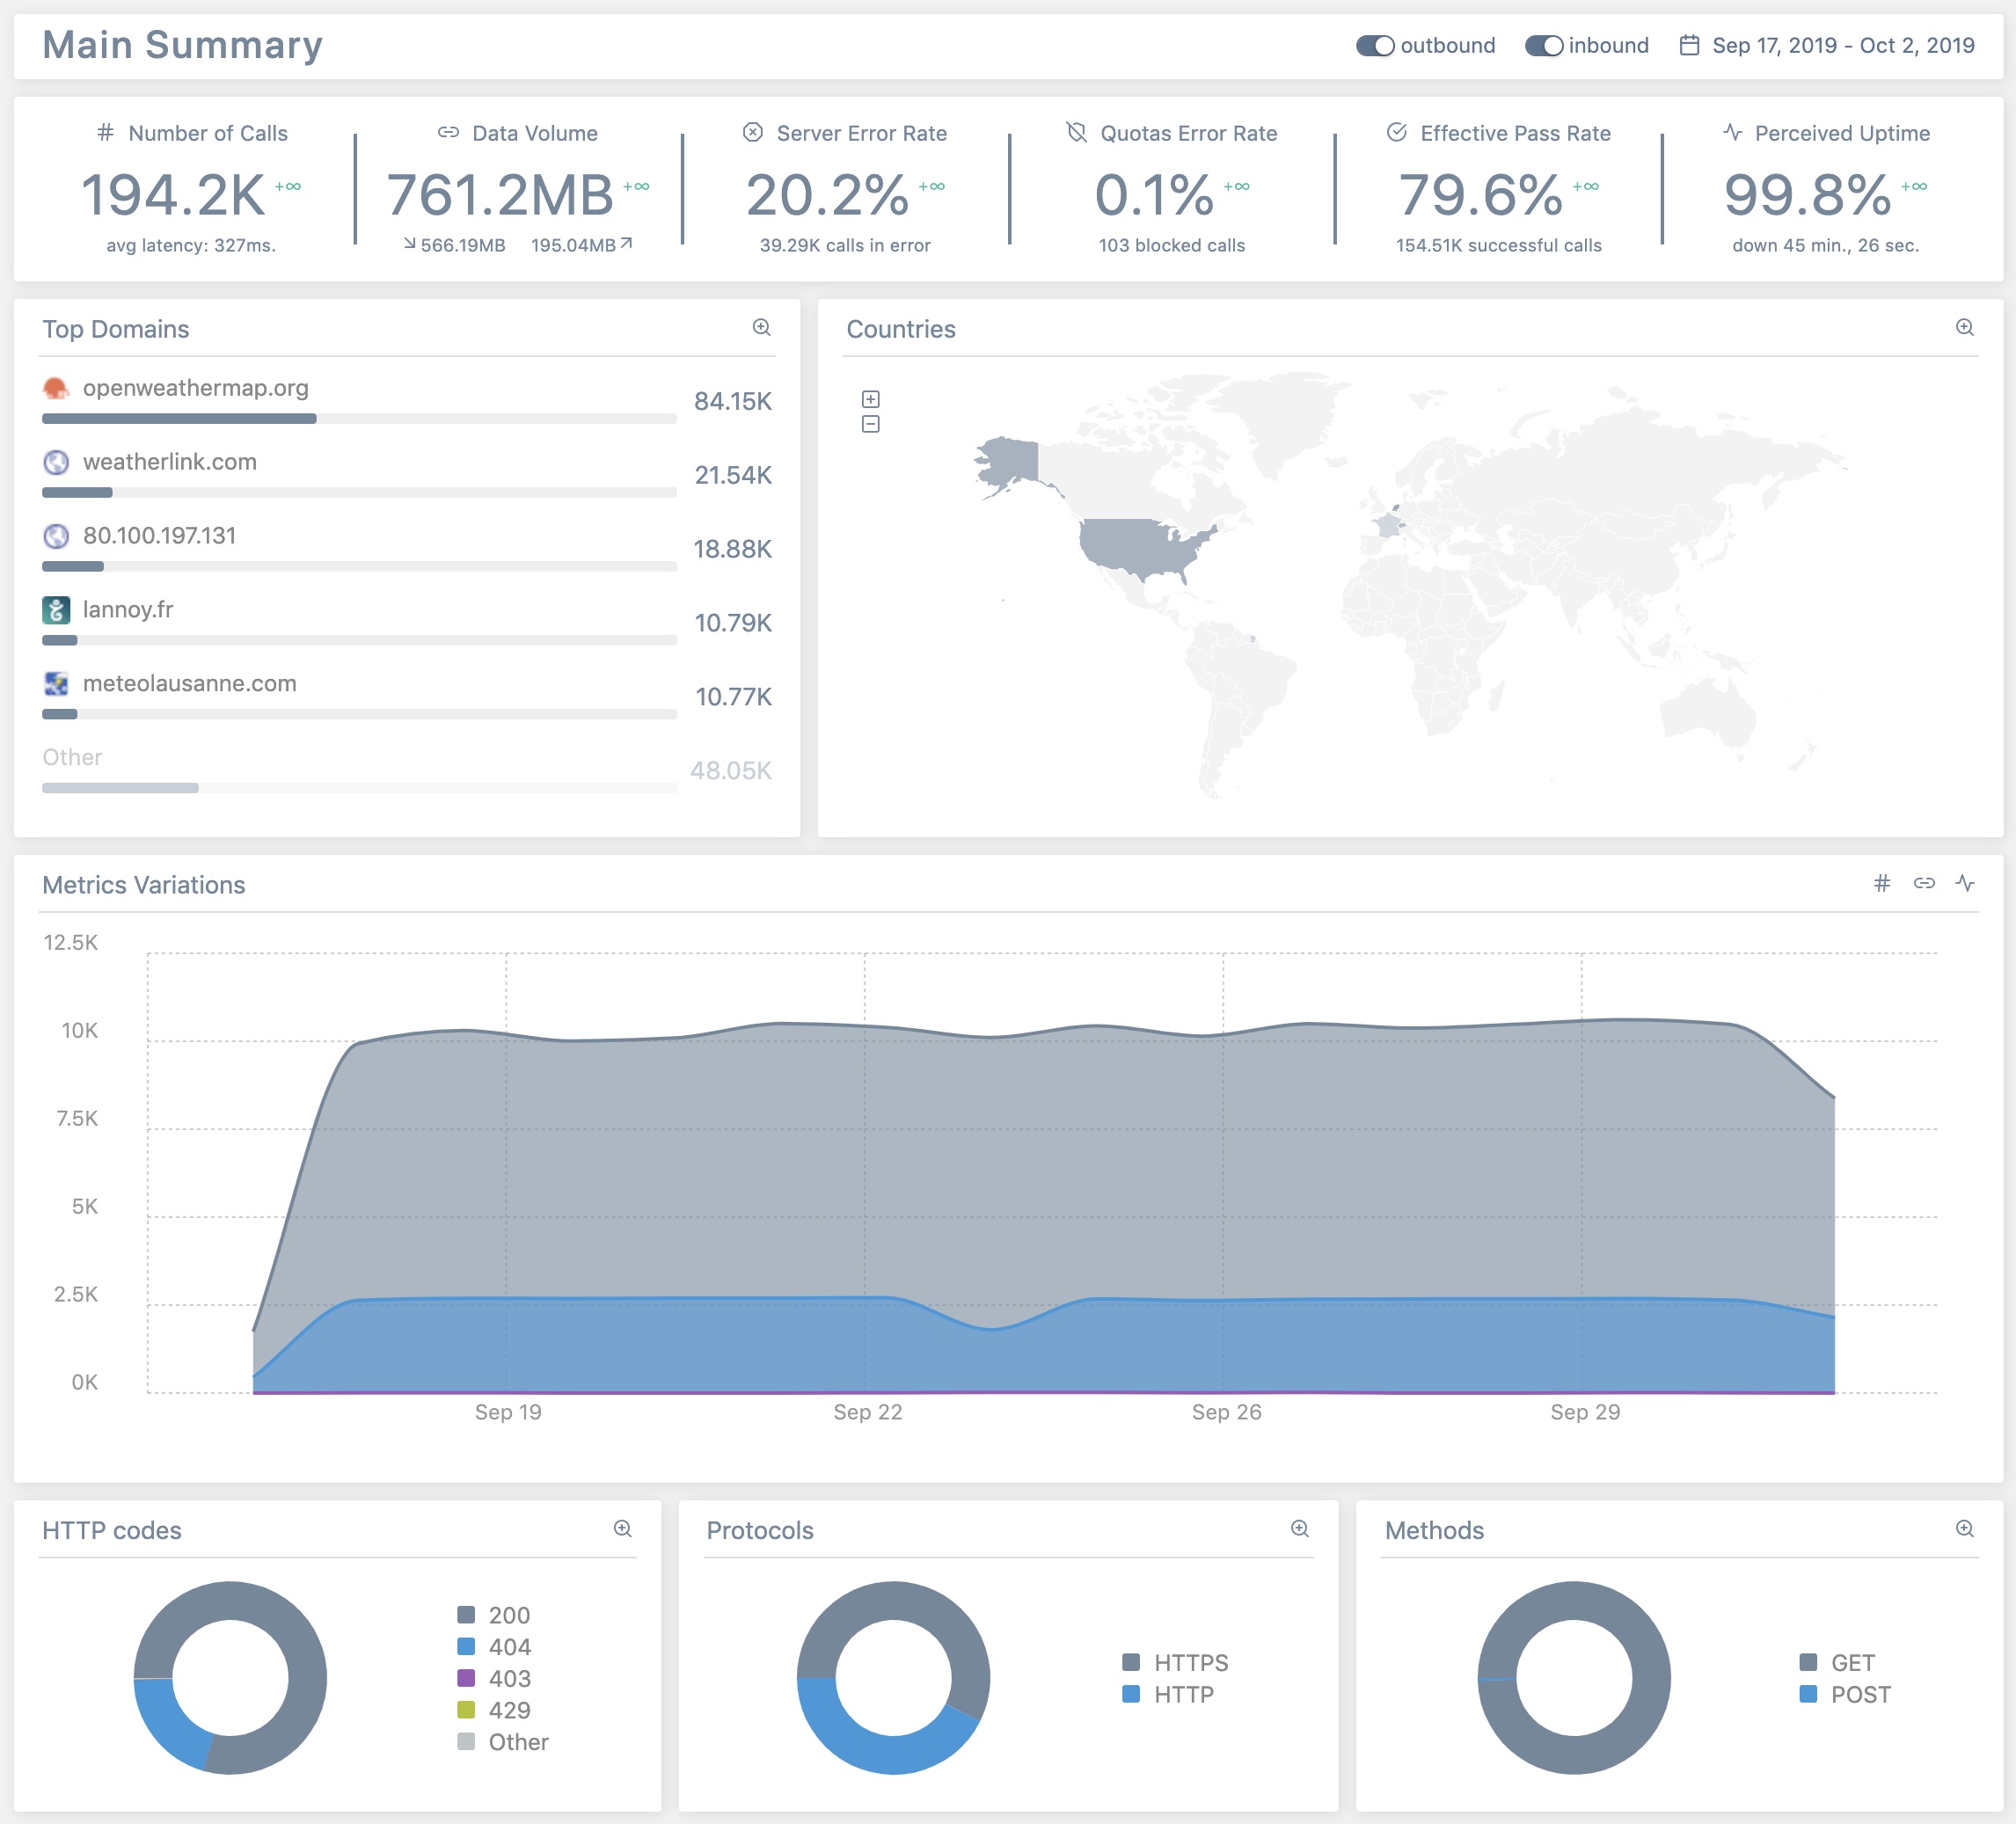
Traffic is a full featured analytics reporting tool that analyzes all inbound and outbound API calls made to/from your site.
At this time, Traffic can report, for inbound and outbound traffic:
- KPIs: number of calls, data volume, server error rate, quotas error rate, effective pass rate and perceived uptime;
- domains, subdomains and endpoints details;
- metrics variations;
- HTTP codes, protocols and methods details;
- geographical repartition of calls;
Traffic supports multisite report delegation (see FAQ).
Traffic supports WP-CLI commands to:
- display (past or current) API calls in console – see
wp help api tailfor details; - toggle on/off main settings – see
wp help api settingsfor details.
For a full help on WP-CLI commands in Traffic, please read this guide.
Traffic is part of PerfOps One, a suite of free and open source WordPress plugins dedicated to observability and operations performance.
Traffic is a free and open source plugin for WordPress. It integrates many other free and open source works (as-is or modified). Please, see ‘about’ tab in the plugin settings to see the details.
Support
This plugin is free and provided without warranty of any kind. Use it at your own risk, I’m not responsible for any improper use of this plugin, nor for any damage it might cause to your site. Always backup all your data before installing a new plugin.
Anyway, I’ll be glad to help you if you encounter issues when using this plugin. Please read carefully the FAQ at the bottom of this page before requesting support.
Donation
If you like this plugin or find it useful and want to thank me for the work done, please consider making a donation to La Quadrature Du Net or the Electronic Frontier Foundation which are advocacy groups defending the rights and freedoms of citizens on the Internet. By supporting them, you help the daily actions they perform to defend our fundamental freedoms!
螢幕擷圖
Main Page 
Domains List 
Countries List 
HTTP Codes List 
Subdomain Details – Endpoints List 
Endpoint Summary 
Live Monitoring
安裝方式
From your WordPress dashboard
- Visit ‘Plugins > Add New’.
- Search for ‘Traffic’.
- Click on the ‘Install Now’ button.
- Activate Traffic.
From WordPress.org
- Download Traffic.
- Upload the
trafficdirectory to your/wp-content/plugins/directory, using your favorite method (ftp, sftp, scp, etc…). - Activate Traffic from your Plugins page.
Once Activated
- Visit ‘PerfOps One > Control Center > Traffic’ in the left-hand menu of your WP Admin to adjust settings.
- Enjoy!
常見問題集
-
Can this plugin work on multisite?
-
Yes. It is designed to work on multisite too. Network Admins can configure the plugin and have access to all analytics reports. Sites Admins have access to the analytics reports of their sites.
-
Where can I get support?
-
Support is provided via the official WordPress page. Because I am human myself, please note that I only answer to support requests made by humans, who behave like humans. This excludes requests or bug reports written by AI or those that do not adhere to basic rules of courtesy.
-
Where can I report a bug?
-
You can report bugs and suggest ideas via the GitHub issue tracker of the plugin.
使用者評論
這個外掛目前沒有任何使用者評論。
參與者及開發者
變更記錄
Please, see full changelog.