外掛說明
WordPress Chart Plugin
WordPress Chart Plugin is designed to build both static and dynamic charts, graphs and diagrams for your WordPress website. Interactive Charts WordPress can display in three methods: manually inputting data, linking to your Google Spreadsheet, or querying your preferred database.
Create an unlimited number of wordpress chart using the various chart types included in the WordPress data visualization plugin.
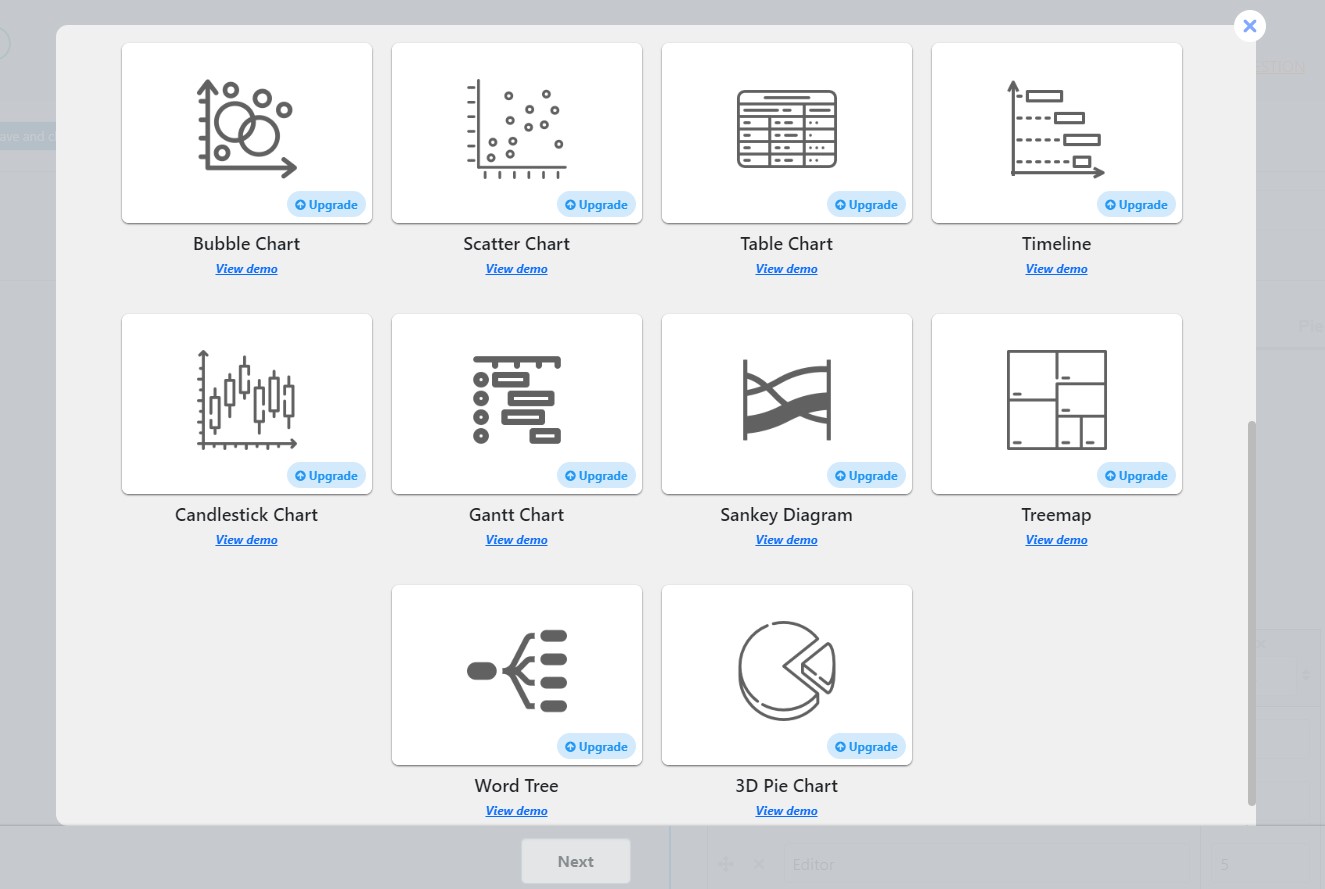
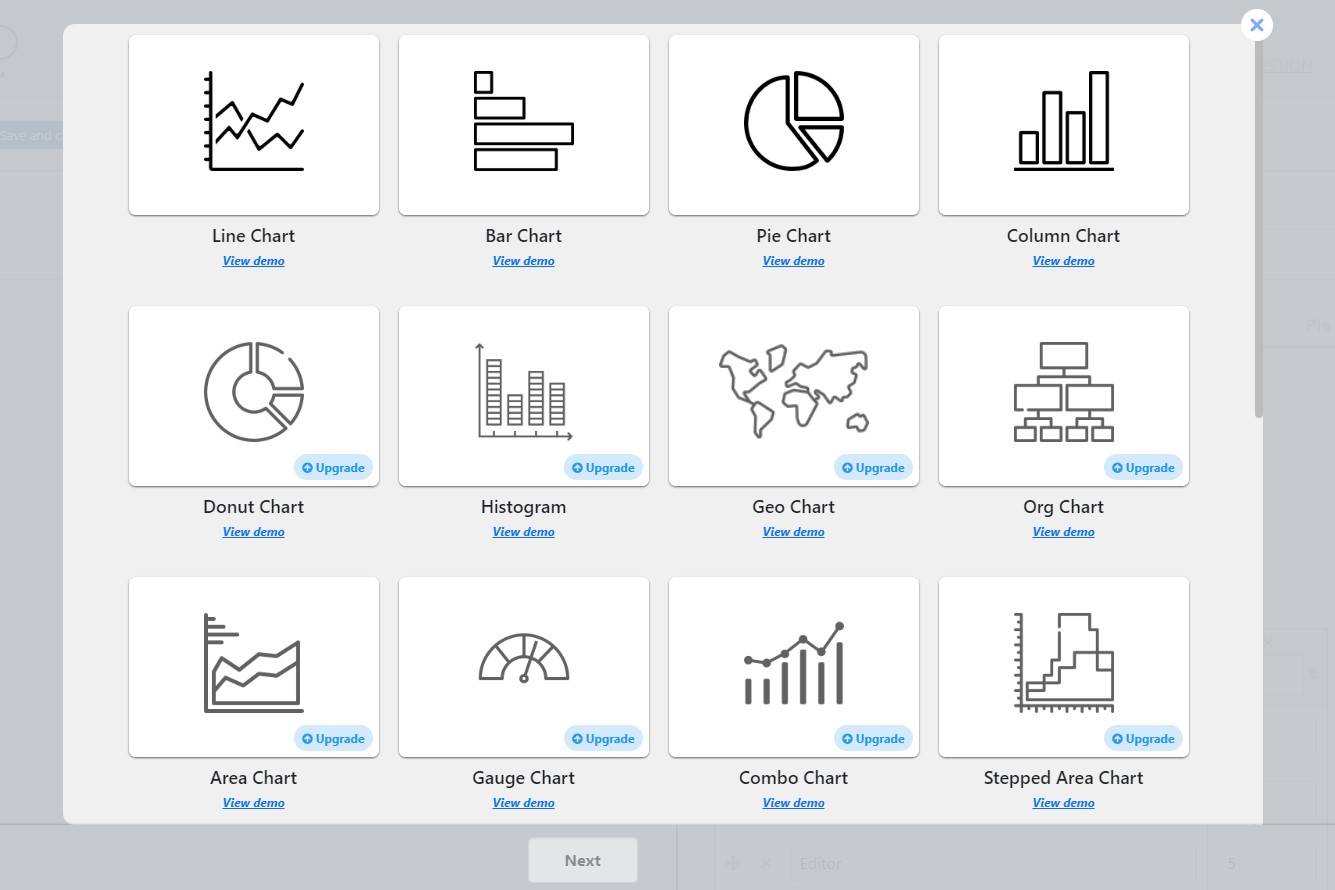
22 Available Chart Types Demos
- Line Chart
- Pie Chart
- Bar Chart
- Column Chart
- Donut Chart
- Histogram
- Geo Chart
- Org Chart
- Combo Chart
- Stepped Area Chart
- Gauge Chart
- Area Chart
- Bubble Chart
- Scatter Chart
- Table Chart
- 3D Pie Chart
- Timeline
- Candlestick Chart
- Gantt Chart
- Sankey Diagram
- Treemap Chart
- Word Tree Chart
Why choose us among other WordPress Chart Builder Plugins?
With Chartify, you will have responsive charts & graphs into your WordPress posts and pages. Create dynamic charts that will automatically updated based on your data. When you add your data to your Google sheet, the charts inserted on your website will automatically be adjusted in excel style.
Moreover, the WordPress Graph plugin allows you to view your chart on your dashboard via live preview functionality. See it before publishing and make all the necessary changes.
Most importantly, the WordPress Graphs & Charts has a professional support team, that is always will be by your side while using this visualizer plugin.
Feel free to write topics on the FREE SUPPORT FORUM in case of having any questions about the plugin. All your desires can be achieved with the WordPress chart plugin.
Easy-to-use | Intuitive Design | Mobile-Friendly
A beginner-friendly and intuitive interface makes the process of creating charts easy than ever. If you have no data visualization background, no problem at all – you can build attractive charts and graphs like an expert with this visualizer wordpress tool.
With WordPress data visualization plugin create visual charts that can help you to create engaging content for your audience. No matter what profession you have, responsive charts are essential tools for you.
Chart plugin is designed for:
- Business owners to show their business trends over time
- Business analysts
- Data analysts
- Stock marketers
- Sports statistics website owners
- Teachers, Tutors to display their student’s stats.
- Newspapers to show infographics in their articles.
- Bloggers, Vloggers to show their growth stats.
- Scientific researchers.
- Those, who looking for gaining business investors
- Those, who want to present info to board members
- Those, who want to show their staff directory via organization chart
- Those, who want to visually show insights from your quizzes, polls, surveys, etc
How to Use
- Create a chart by clicking on the Add New button.
- Choose your preferred chart type.
- Add your data manually.
- Copy the generated shortcode and paste it into your desired post/page.
Chart shortcode
[ays_chart id=”chart_id”]
DATA SOURCES
- Manual Data
- Google Spreadsheet
- Query from Database
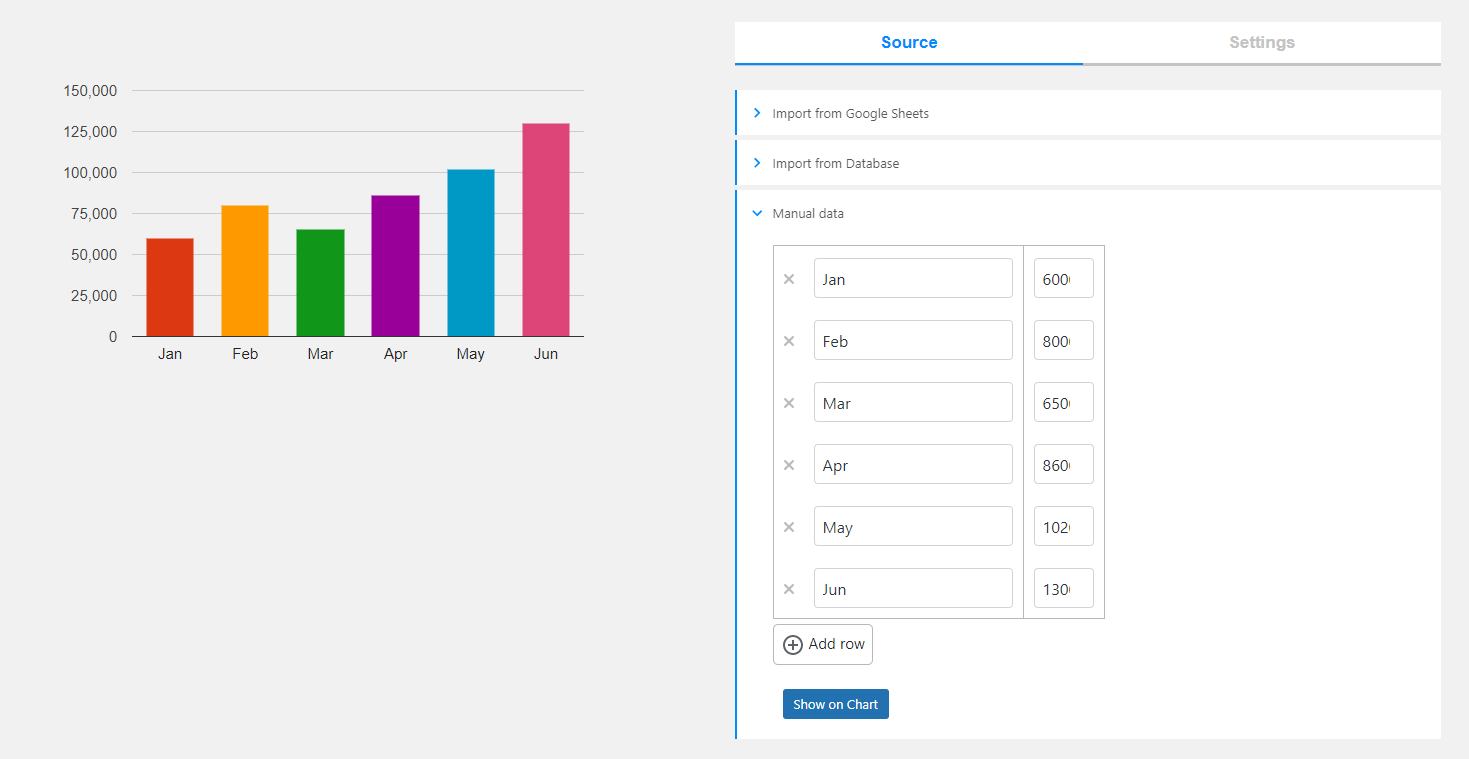
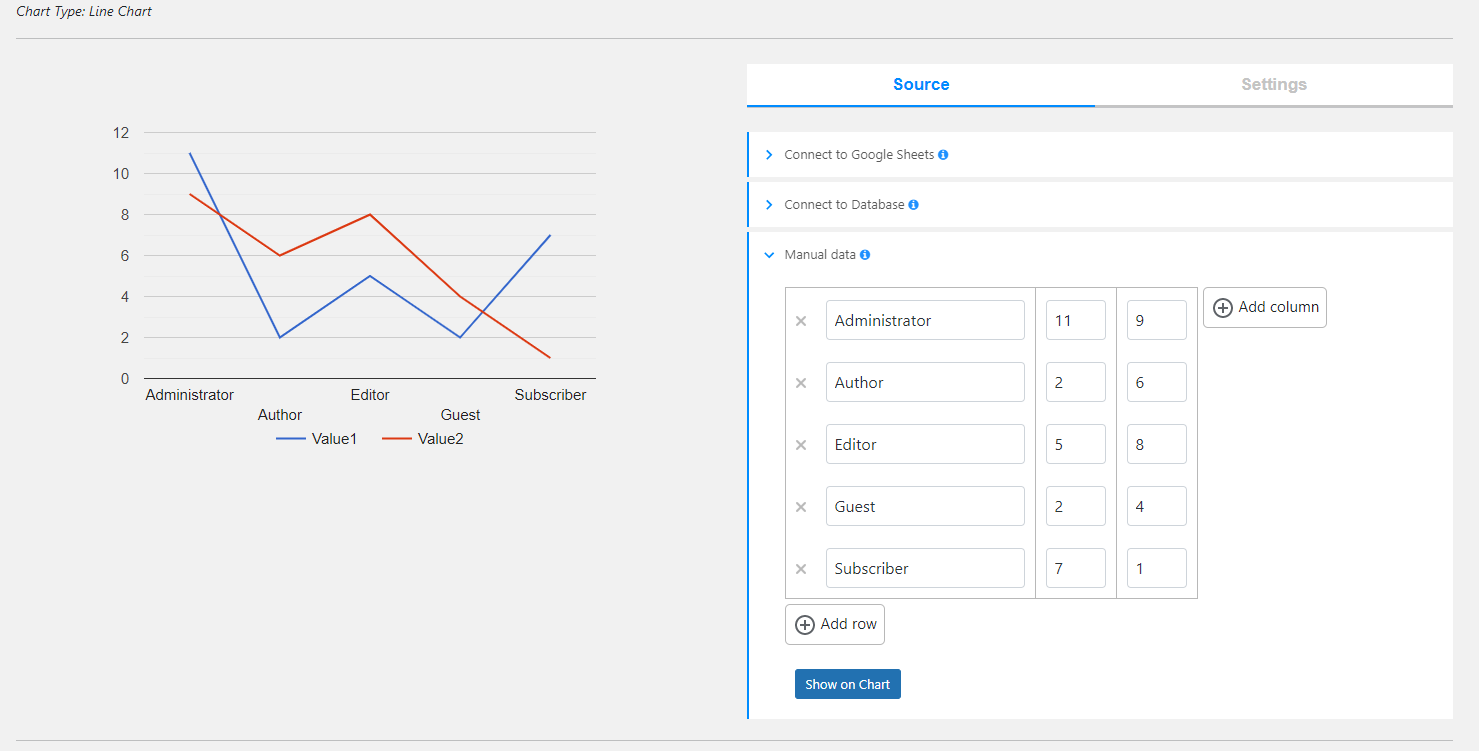
Build Charts by manually entering data
Have plain data and want to extract insights? Or do you want to show charts for wordpress and convince or clarify a point? It is no matter a problem with the Chartify visualizer plugin. With WordPress Chart Plugin for Visualizing Data you can create a chart by manually adding the needed data to any chart type you want.
Build Charts from Google Spreadsheet
Easily connect Chartify to your Google Sheets without having any coding skills. Keep charts up to date with your data from your spreadsheet. Have your data displayed like in excel in seconds. Most importantly, you do need to configure the chart settings to update the chart plugin it will be updated automatically when you add or change any data from your spreadsheet. Have visual data representation and save your data with us. Amazing, isn’t it?
Build Charts by querying the database
Quickly create charts based on your query data with Responsive Chart Plugin. Here you need to have some development skills. This ideally works for visualizing frequency distribution and displaying a comparison over time; x per day, per month, etc. Make colorful charts from your data and create data-driven decisions for your business with our Chart Maker.
Visualize Quiz Data with WordPress Chart Plugin
If you are using the Quiz Maker plugin, you’ve got a special opportunity to make interactive graphs for WordPress out of it. Visual data representation even easier now.
Connect your Chart Builder plugin to the Quiz Maker and display the data of your quizzes in various chart types. Using graphical data representation plugin, you can make all sorts of graphical data to show how many people got quiz questions right or wrong, or wordpress diagram that explain who’s taking your quizzes with responsive Chart Plugin. By putting together the Quiz Maker plugin and Chart WordPress plugin, you’re not just making quizzes more fun. You’re turning quiz results into something super useful with WordPress Analytics Charts. You can see trends, understand how people are doing, and use that info to make your content even better.
It’s like turning numbers into data that everyone can understand with interactive Charts WordPress.
Chart Types that can be useful for your WordPress data visualization
Display the data in various chart types in Chart WordPress plugin. With WordPress visualizer make use of the popular types and show the results in your preferred way.
Organizational Chart, will be useful for you to see your team’s structure on your WordPress site.
With Organization Chart WordPress plugin you can easily put this map on your website and make it understandable for your visitors how your team works together.
The Geo Chart for example, can help you to explore facts about places all around the world. It’s like a map that shows interesting things about different areas in charts for WordPress.
But the mentioned types are just a small part of the possibilities the best WordPress Chart plugin offers to you. Make sure to try the charts wordpress plugin by yourself and enjoy the 20+ chart types in Interactive Graphs for WordPress.
Embed Chart with Shortcode in Gutenberg
If you are using Gutenberg, you are free to embed chart with shortcode.
With the user-friendly interface, your WordPress data visualization results will look eye-catching on your WordPress website.
Features
- Line Chart
- Bar Chart
- Pie Chart
- Column Chart
- Manual Data Entry
- Live preview
- Responsive design
- Permissions of charts
PREMIUM FEATURES
- Donut Chart
- Histogram
- Geo Chart
- Org Chart
- Area Chart
- Gauge Chart
- Combo Chart
- Stepped Area Chart
- Bubble Chart
- Scatter Chart
- Table Chart
- Timeline
- Candlestick Chart
- Gantt Chart
- Sankey Diagram
- Treemap
- Word Tree
- 3D Pie Chart
- Google Integration
- Database Entry
3RD PARTY OR EXTERNAL SERVICE DISCLAIMER
The plugin uses Google Charts (https://developers.google.com/chart). The charts included in the plugin generate in Google scripts.
It does not send any data nor do we collect information from the request.
The privacy policy can be found at this URL https://developers.google.com/chart/interactive/docs/security_privacy
In case of any further questions feel free to contact us via the following FREE SUPPORT FORUM.
Other plugins from Ays Pro Team
- Quiz Maker for creating advanced quizzes and exams easily and quickly.
- Survey Maker for collecting data and analyze it.
- Fox LMS to easily build and manage online courses directly from your WordPress LMS website.
- Poll Maker for creating powerful and interactive polls.
- Popup Box, an easy way to create eye-catching and engaging popups.
- Secure Copy Content Protection to protect web content from being plagiarized.
- Easy Form to create various forms for your website.
- AI ChatBot to generate high-quality content for your blog, and finding the answer to any questions in seconds.
- Personal Dictionary to create and organize their vocabulary lists, study and memorize the words.
- FAQ Builder to display Frequently Asked Questions on your website with a beautiful accordion.
- Image Slider give the aility to grab your audience’s attention with amazing and entertaining slideshows.
- Random Posts and Pages Widget for creating internal links and encouraging visitor engagement on your website.
- Popup Like box to promote your Facebook page and add number of Likes.
- Advanced Related Posts allows you to show a related posts list on your website after a post or via a widget.
- Photo Gallery for displaying responsive image gallery with awesome layout options.
- Portfolio Responsive Gallery to showcase beautiful image galleries on your WordPress websites.
螢幕擷圖
適用於區塊編輯器
這個外掛提供 1 個可供 Gutenberg/區塊編輯器使用的區塊。
- Chart Builder
安裝方式
Let’s learn how to install the WordPress Chart Builder plugin together. There are two ways to do that.
The first way: 1. Log in to your WordPress website dashboard. 2. Move to the Plugins section on the left navigation menu. 3. Click on the Add New button. 3. Enter Chartify in the search box. 4. Click on Install Now button. 5. Click on the Activate Now button.
The second way: 1. Download the zip file from the Chartify wp.org page via the Download button. 2. Go to the Plugins section on your WordPress website dashboard. 3. Click on the Add New button. 4. Click on the Upload plugin button and upload the file you downloaded beforehand via Choose file button. 5. Click on the Install Now button. 6. Do not forget to activate it.
That’s all. Enjoy the plugin and if you need help, feel free to write to our support specialist via the following free support form.
常見問題集
-
1. How much data can I add to my chart?
-
Unlimited data! Amazing, isn’t it? You can add a large amount of data to your chart no matter which source you used. Turn your big data into attractive charts and insert them on your WordPress website to make it appear more eye-catching.
-
2. How to insert a chart into a post or page?
-
Easy-peasy! Let’s do that together in three easy steps: 1. click on the Add New button and choose your preferred chart type. 2. Populate your data with your desired source type(manual, Google Sheet or Database). 3. Save and paste the generated shortcode into the post/page you wish. There you are! Gain meaningful insights from your data with the help of this data visualization maker.
-
3. Can I add the data manually?
-
Manual data is one of the available source data the chart plugin offers. You just need to go to the dashboard of your website, then click on the Chartify plugin from the left navbar, create a new chart and fill in your data manually. You can add as many rows and columns as you wish. You can live preview your chart before publishing them. Build the best charts with the advanced features available in the wp chart plugin.
-
4. Does the chart plugin work with any theme?
-
As far as we tested – YES. The Chart Maker plugin is compatible with all the themes we came across on our way. In the case of facing any kind of issues, do not hesitate to contact our support experts via the support forum. AYS Pro developed a tool to make dynamic data visualization processes effortlessly for you.
-
5. Will I lose the data after upgrading to the Pro version?
-
Absolutely nope. Your data is safe and sound with us. Moreover, please note that your data is being saved only in your database and we do not have any access to it. So, coming back to the question, in order to not lose your data, you need to upgrade the plugin in the right way. To do that, follow the steps in this article. Make sure to choose the best chart plugin for WordPress as you deserve to have one.
-
6. Is there any documentation or user guide?
-
Of course! Check out the Chart Plugin documentation to see available features the plugin offers and read about the functionality they provide.
-
7. I have an issue or a suggestion, how can I contact you?
-
If you have suggestions or questions about the free version, do not hesitate to write a thread in the free support forum. Our support specialist will answer you within 12 hours of a working day. If you have pre-sale questions and would like to decide whether you want to purchase or not, feel free to contact our sales experts via the following contact us form.
使用者評論
參與者及開發者
變更記錄
3.7.6 ( Jun 24, 2026 )
- Added: “Font size” option in Chart.js charts tooltip
- Added: “Bold text” option in Chart.js charts tooltip
- Updated: POT file
3.7.5 ( May 27, 2026 )
- Improved: Some style and content changes on the admin dashboard
- Updated: POT file
3.7.4 ( Apr 30, 2026 )
- Added: “Italic text” option in Chart.js tooltip
- Improved: Some changes on the admin dashboard
3.7.3 ( Apr 13, 2026 )
- Improved: Some changes on the admin dashboard
- Tested: Compatible up to WP 7.0
3.7.2 ( Mar 31, 2026 )
- Added: “Show Color Code” option for Pie chart in Chart.js
- Updated: POT file
- Tested: Compatible up to 6.9
3.7.1 ( Mar 12, 2026 )
- Improved: Some changes on the admin dashboard
- Tested: Compatible up to 6.9
3.7.0 ( Feb 20, 2026 )
- Improved: Code quality on the admin dashboard
- Fixed: PHP error on the front end when using the Chart.js type
3.6.9 ( Jan 26, 2026 )
- Improved: Some changes on the admin dashboard
- Updated: POT file
- Tested: Compatible up to 6.9
3.6.8 ( Jan 20, 2025 )
- Improved: Styles on the admin dashboard
3.6.7 ( Dec 25, 2025 )
- Improved: Styles on the admin dashboard
3.6.6 ( Dec 5, 2025 )
- Improved: Styles on the admin dashboard
3.6.5 ( Nov 25, 2025 )
- Improved: Styles on the admin dashboard
3.6.4 ( Nov 20, 2025 )
- Improved: Admin dashboard functionality
3.6.3 ( Oct 23, 2025 )
- Improved: Styles on the admin dashboard
3.6.2 ( Oct 20, 2025 )
- Fixed: Org Chart siblings ordering issue
3.6.1 ( Oct 8, 2025 )
- Improved: Admin dashboard functionality
3.6.0 ( Oct 3, 2025 )
- Improved: Admin dashboard functionality
3.5.9 ( Sep 25, 2025 )
- Improved: Styles on the admin dashboard
3.5.8 ( Aug 20, 2025 )
- Improved: Styles on the admin dashboard
3.5.7 ( Aug 5, 2025 )
- Improved: Admin dashboard performance
3.5.6 ( Jul 29, 2025 )
- Added: Chart.js pie chart slice border color option
3.5.5 ( Jul 22, 2025 )
- Fixed: Chart.js height option issue
3.5.4 ( Jul 15, 2025 )
- Added: Chart.js width and height options
- Fixed: Vulnerability issue
- Fixed: Some language translation issues
3.5.3 ( Jul 8, 2025 )
- Added: Shadow effect on pie chart slices when hovered in Chart.js
- Updated: POT file
3.5.2 ( Jul 1, 2025 )
- Added: Chart.js Legend label italic and bold options
3.5.1 ( Jun 24, 2025 )
- Added: Chart.js Border width and Color options for the Pie Chart Settings
3.5.0 ( Jun 17, 2025 )
- Added: Chart.js Tooltip color option
3.4.9 ( Jun 12, 2025 )
- Added: “Show datasets in reverse order” toggle to the Legend settings for Chart.js
- Fixed: Language translation problem
3.4.8 ( Jun 10, 2025 )
- Added: Chart.js Legend alignment option
3.4.7 ( Jun 5, 2025 )
- Added: Chart.js Legend position option
- Fixed: Animation problem on the admin dashboard
- Fixed: Conflict with Phlox theme
3.4.6 ( Jun 3, 2025 )
- Added: Chart.js Legend font size option
3.4.5 ( May 29, 2025 )
- Added: Chart.js Legend color option
- Fixed: Conflict with Pixel Ebook Store theme
- Fixed: Conflict with Interactive Education theme
3.4.4 ( May 23, 2025 )
- Added: Chart.js Slice color option
3.4.3 ( May 21, 2025 )
- Added: Chart Padding option for Chart JS
- Fixed: CSS conflict with the WP Social Login and Register plugin
3.4.2 ( May 16, 2025 )
- Added: Chart Border Style (including title) option for Chart JS
3.4.1 ( May 13, 2025 )
- Added: Chart Border Color (including title) option for Chart JS
3.4.0
- Updated: POT file
3.3.9
- Improved: Styles on the admin dashboard
3.3.8
- Added: Preview link functionality after saving old charts
- Added: Fox LMS Plugin to the Our Products page
3.3.7
- Added: Auto-generate custom post for the Front-end chart immediate preview
- Added: Preview link on the charts list table
- Added: Preview Chart button on the on the Preview popup
3.3.6
- Added: Added: Percent format fix toggle to remove extra zeros
- Tested: Compatible up to 6.8
3.3.5
- Added: Chart Series Format Option
3.3.4
- Improved: Some styles on the admin dashboard
3.3.3
- Added: Chart Border Radius (including title) option for Chart JS
3.3.2
- Added: Chart Border Width (including title) option for Chart JS
3.3.1
- Added: Box shadow color for Chart JS
3.3.0
- Added: Background color for Chart JS
3.2.9
- Improved: Some changes on the admin dashboard
- Updated: POT file
3.2.8
- Improved: Styles on the admin dashboard
3.2.7
- Improved: Styles on the admin dashboard
3.2.6
- Improved: Styles on the admin dashboard
3.2.5
- Improved: Styles on the admin dashboard
3.2.4
- Improved: Styles on the admin dashboard
3.2.3
- Added: Chart.js Chart box shadow option
- Tested: Compatible up to 6.7.2
3.2.2
- Added: Chart.js Chart border style option
3.2.1
- Improved: Styles on the admin dashboard
3.2.0
- Added: Chart.js Chart border color option
3.1.9
- Improved: Styles on the admin dashboard
3.1.8
- Added: Chart.js Chart border radius option
3.1.7
- Added: Chart.js Chart border width option
3.1.6
- Added: Chart Border Style option
3.1.5
- Improved: Chart display functionality
3.1.4
- Added: Chart Border Style (including title) option
3.1.3
- Improved: Styles on the admin dashboard
3.1.2
- Improved: Styles on the admin dashboard
3.1.1
- Added: Chart padding option
3.1.0
- Added: Chart Border Radius (including title) option
3.0.9
- Added: Chart Border Color (including title) option
3.0.8
- Added: Chart Border Width (including title) option
3.0.7
- Fixed: Google chart border radius issue
3.0.6
- Improved: Styles on the admin dashboard
3.0.5
- Improved: Chart preview functionality
3.0.4
- Improved: Styles on the admin dashboard
3.0.3
- Improved: Chart.js Chart preview functionality
3.0.2
- Improved: Chart preview functionality
3.0.1
- Improved: Styles on the admin dashboard
- Tested: Compatible up to 6.7.1
3.0.0
- Added: Google charts chart box shadow color option
2.9.9
- Added: Google charts chart box shadow option
2.9.8
- Fixed: JS issue on the admin dashboard
2.9.7
- Improved: Search functionality on charts page
- Tested: Compatible up to 6.7
2.9.6
- Improved: Styles on the admin dashboard
2.9.5
- Added: Chart title distance from description option
2.9.4
- Fixed: Org chart display issues on the front end
2.9.3
- Added: Chart description text shadow color option
2.9.2
- Added: Chart description text shadow option
2.9.1
- Added: Chart title text shadow color option
2.9.0
- Added: Chart title text shadow option
2.8.9
- Fixed: Styles on the admin dashboard
2.8.8
- Improved: Styles on the admin dashboard
2.8.7
- Fixed: Chart style issue on the frontend
2.8.6
- Added: Chart.js pie chart Start Angle option
2.8.5
- Added: Chart.js pie chart Arc Coverage option
2.8.4
- Added: Chart.js pie chart Slice Spacing option
2.8.3
- Improved: Styles on the admin dashboard
2.8.2
- Fixed: Some issues on the admin dashboard
2.8.1
- Added: Chart.js pie chart Outer Radius option
2.8.0
- Added: Chart.js default chart
- Tested: Compatible up to 6.6.2
2.7.9
- Added: Filter by chart source functionality on the charts page
2.7.8
- Fixed: Few issues on the frontend
2.7.7
- Fixed: Few issues on the admin dashboard
2.7.6
- Added: Chart.js chart source type
- Added: Chart.js Pie chart type
- Added: Chart.js Bar chart type
- Added: Chart.js Line chart type
2.7.5
- Fixed: Line chart dash pattern option issue
2.7.4
- Added: Description text decoration option
2.7.3
- Improved: Styles on the admin dashboard
2.7.2
- Added: Title text decoration option
2.7.1
- Fixed: Issue with Elementor plugin
2.7.0
- Added: New query for the Quiz Maker source type
2.6.9
- Improved: Manual data navigation with Enter key
2.6.8
- Improved: Styles on the admin dashboard
2.6.7
- Added: Description letter spacing option
2.6.6
- Added: Title letter spacing option
- Tested: Compatible up to 6.6.1
2.6.5
- Added: Description text transform option
2.6.4
- Added: Title text transform option
2.6.3
- Fixed: Issue with Elementor plugin
2.6.2
- Added: Line chart dash pattern option
- Tested: Compatible up to 6.6
2.6.1
- Fixed: Styles on the admin dashboard
2.6.0
- Added: Organization chart selected node text color option
2.5.9
- Fixed: Chart display issues on the front page
2.5.8
- Added: Organization chart selected node background color option
- Tested: Compatible up to 6.5.5
2.5.7
- Added: Organization chart selected node custom CSS class option
2.5.6
- Added: Series point shape option for line chart
2.5.5
- Added: Series point size option for line chart
2.5.4
- Improved: Styles on the admin dashboard
2.5.3
- Fixed: Chart line width issue
2.5.2
- Added: Series line width option for line chart
- Tested: Compatible up to 6.5.4
2.5.1
- Improved: Styles on the admin dashboard
2.5.0
- Added: Filter by date functionality on the charts page
2.4.9
- Fixed: PHP issue on the charts edit page
- Improved: Styles on the admin dashboard
2.4.8
- Added: Filters ordering functionality on the charts page
2.4.7
- Added: Order by functionality on the charts page
2.4.6
- Improved: Charts list table styles
2.4.5
- Added: Filter by source functionality on the charts page
- Added: Source column in the charts list table
- Improved: Styles on the admin dashboard
2.4.4
- Improved: Styles on the admin dashboard
- Tested: Compatible up to 6.5.3
2.4.3
- Improved: Frontend actions button styles on the front page
2.4.2
- Added: Frontend export chart as image action
2.4.1
- Improved: Styles on the admin dashboard
2.4.0
- Added: Organization chart border color option
2.3.9
- Fixed: Issue with show chart title option
- Fixed: Issue with decimal numbers not saving in the manual source type
2.3.8
- Added: Organization chart border width option
- Fixed: Chart display issue on the front page
2.3.7
- Improved: Styles on the admin dashboard
- Tested: Compatible up to 6.5.2
2.3.6
- Fixed: Chart display issues on the front page
2.3.5
- Added: Donut chart type
2.3.4
- Improved: Styles on the admin dashboard
2.3.3
- Added: Organization chart description font size option
2.3.2
- Fixed: Issue with decimal numbers not saving in the manual source type
2.3.1
- Added: Organization chart description color option
- Tested: Compatible up to 6.5
2.3.0
- Fixed: Style issues on the admin dashboard
2.2.9
- Added: Organization chart text font size option
2.2.8
- Added: Organization chart text color option
- Fixed: Series color option issue
2.2.7
- Added: Organization chart border radius option
2.2.6
- Added: Organization chart padding option
- Fixed: Chart border radius option issue
2.2.5
- Added: Organization chart Custom CSS class option
- Added: Organization chart Background color option
2.2.4
- Added: Organization chart allow collapse option
2.2.3
- Added: Organization chart element size option
2.2.2
- Added: Organization chart type
2.2.1
- Fixed: Issue with Elementor plugin
- Added: Italian language support
- Added: Spanish language support
- Added: French language support
- Added: Dutch language support
- Added: Portuguese language support
- Added: Russian language support
2.2.0
- Fixed: Styles on the admin dashboard
2.1.9
- Added: Horizontal axis Label interval option
2.1.8
- Added: Enable row settings option in the row settings tab
- Fixed: Sanitizing issues on the admin dashboard
2.1.7
- Added: Axes baseline color option
2.1.6
- Added: Single bar opacity option in the row settings tab
2.1.5
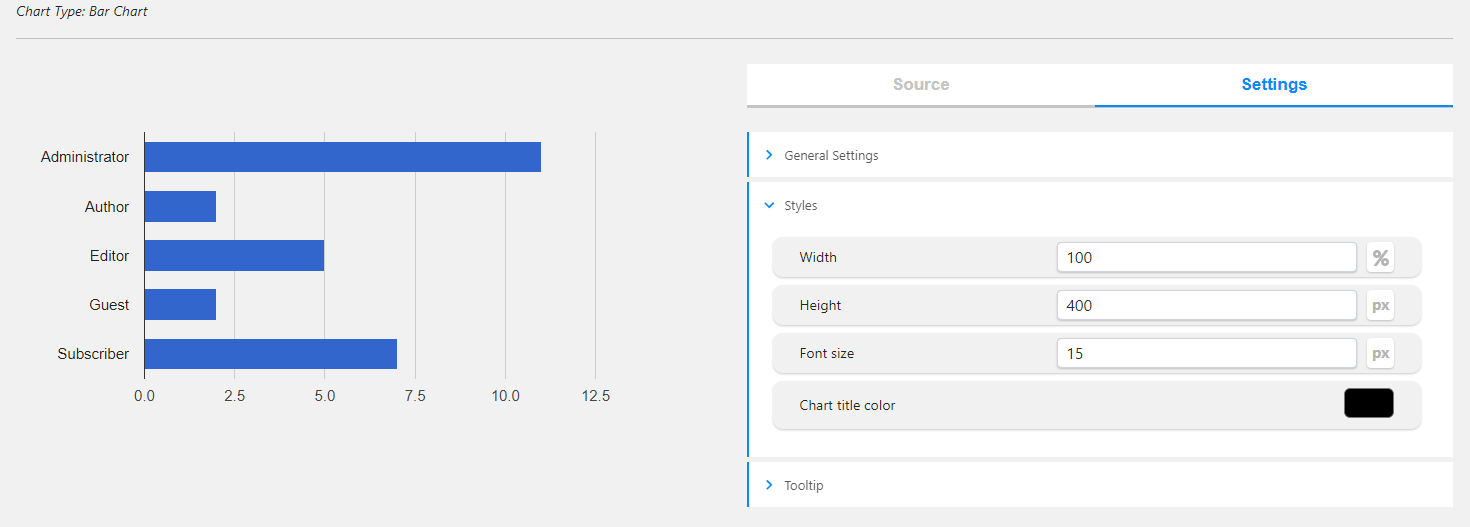
- Added: Styles tab on the admin dashboard
2.1.4
- Added: Transparent background option
- Improved: Styles on the admin dashboard
2.1.3
- Added: Information popup about the form after creating a form
- Improved: Styles on the admin dashboard
2.1.2
- Added: Bar, column chart row settings tab
- Added: Bar, column chart single bar color option
- Fixed: Chart display issue on the front end
2.1.1
- Added: Chart border radius option
2.1.0
- Fixed: Banner countdown issue
2.0.9
- Improved: Live chart functionality on the admin dashboard
2.0.8
- Improved: Styles on the admin dashboard
2.0.7
- Improved: Styles on the admin dashboard
2.0.6
- Added: Chart position option
2.0.5
- Added: Axes minor gridlines color option
2.0.4
- Added: Axes gridlines color option
2.0.3
- Added: Axes label italic and bold options
2.0.2
- Added: Axes text italic and bold options
2.0.1
- Added: Line chart autofill nulls option
2.0.0
- Added: Duplicate action for charts
1.9.9
- Added: Chart title italic option
- Added: Chart description italic option
1.9.8
- Added: Chart title bold option
- Added: Chart description bold option
1.9.7
- Fixed: Style issues on the front end
- Fixed: Security issues on the admin dashboard
- Tested: Compatible up to 6.4.1
1.9.6
- Improved: Styles on the admin dashboard
1.9.5
- Added: Axes label font color option
- Added: Axes text font size option
1.9.4
- Added: Legend text italic and bold options
- Added: Tooltip text bold option
1.9.3
- Added: Tooltip text italic option
1.9.2
- Added: Legend font size option
1.9.1
- Added: Tooltip font size option
- Tested: Compatible up to 6.4
1.9.0
- Added: Chart description position option
1.8.9
- Added: Line chart crosshair opacity option
- Improved: Styles on the admin dashboard
1.8.8
- Added: Line chart crosshair orientation option
1.8.7
- Added: Line chart crosshair trigger option
1.8.6
- Fixed: Some issues on the admin dashboard
1.8.5
- Improved: Styles on the Add New page
- Tested: Compatible up to 6.3.2
1.8.4
- Added: Functionality to change chart types directly from the edit page
1.8.3
- Improved: Styles on the admin dashboard
1.8.2
- Added: Status column in the charts list table
- Added: Date column in the charts list table
1.8.1
- Improved: Styles on the admin dashboard
1.8.0
- Added: Publish/unpublish action for charts
1.7.9
- Fixed: JS Issues in Our products page
1.7.8
- Added: Ability to set chart width and height in percentage or pixels
- Improved: Bars width option
1.7.7
- Fixed: Styles on the admin dashboard
- Updated: POT file
1.7.6
- Added: Manual data navigation with Enter key
- Updated: POT file
1.7.5
- Added: Chart area margin options
- Fixed: Banner security issue on the admin dashboard
1.7.4
- Added: Chart responsive width option
- Tested: Compatible up to 6.3.1
1.7.3
- Added: Chart border color option
- Added: Chart area border color option
1.7.2
- Added: Chart border width option
- Added: Chart area border width option
1.7.1
- Added: Chart background color option
- Added: Chart area background color option
1.7.0
- Tested: Compatible up to 6.3
- Improved: Dashboard styles
1.6.9
- Added: Axes gridlines count option
1.6.8
- Added: Chart title gap option
- Updated: POT file
1.6.7
- Improved: Dashboard styles
1.6.6
- Added: Axes min/max value options
1.6.5
- Added: Axes label font size option
1.6.4
- Added: Show chart description option
- Fixed: Styles on the admin dashboard
- Fixed: PHP issues on the admin dashboard
1.6.3
- Improved: Deactivate popup style on the plugins page
- Improved: Filters section on the all charts page
1.6.2
- Changed: Styles on the admin dashboard
- Fixed: Bar width option issues
1.6.1
- Added: Maximized view option
1.6.0
- Added: Axes format option
- Fixed: Styles on the admin dashboard
1.5.9
- Added: Manual data ordering by columns functionality
1.5.8
- Added: Manual data ordering functionality
1.5.7
- Changed: Styles on the admin dashboard
1.5.6
- Changed: Styles on the admin dashboard
1.5.5
- Added: Line chart orientation option
1.5.4
- Added: Enable chart interactivity option
1.5.3
- Fixed: Styles on the admin dashboard
1.5.2
- Added: Bar, column charts bar width option
1.5.1
- Added: Pie chart slices text color option
- Updated: POT file
1.5.0
- Added: Pie chart slices offset option
- Added: Bar, column, line chart series visible in legend option
1.4.9
- Added: Pie chart slices settings tab
- Added: Bar, column, line chart series settings tab
- Added: Pie chart slices color option
- Added: Bar, column, line chart series color option
- Changed: CSS Styles on the admin dashboard
1.4.8
- Added: Line chart point size option
1.4.7
- Added: Line chart point shape option
- Tested: Compatible up to 6.2.2
1.4.6
- Added: Line chart multiple data format option
1.4.5
- Added: Line chart multiple data selection option
- Tested: Compatible up to 6.2.1
1.4.4
- Added: Pie chart data grouping label option
- Added: Pie chart data grouping color option
1.4.3
- Added: Pie chart data grouping limit option
1.4.2
- Added: Chart animation startup option
- Added: Chart animation easing option
1.4.1
- Added: Chart animation functionality
- Added: Chart animation duration option
1.4.0
- Added: Chart title position option
- Fixed: Style issues on the front page
1.3.9
- Added: Line chart line width option
1.3.8
- Added: Filter by author functionality on the charts page
- Fixed: Style issues on the admin dashboard
1.3.7
- Added: Filter by chart type functionality on the charts page
- Fixed: Style issues on the admin dashboard
1.3.6
- Added: Search by title functionality on the charts page
- Improved: Legend position option
- Fixed: Style issues on the admin dashboard
1.3.5
- Added: Settings live preview functionality
- Added: Tooltip text color option
1.3.4
- Added: Horizontal axis slanted text option
- Added: Horizontal axis slanted text angle option
- Tested: Compatible up to 6.2
1.3.3
- Added: Horizontal axis text color option
- Added: Vertical axis text color option
1.3.2
- Added: Horizontal axis direction option
- Added: Vertical axis direction option
1.3.1
- Added: Horizontal axis text position option
- Added: Vertical axis text position option
1.3.0
- Added: Horizontal axis title option
- Added: Vertical axis title option
- Changed: CSS Styles on the admin dashboard
1.2.9
- Added: Show chart title option
1.2.8
- Added: Opacity option for line, bar, column types
- Fixed: CSS Styles on admin dashboard
1.2.7
- Added: Change the author of the current chart option
- Changed: CSS Styles on admin dashboard
1.2.6
- Added: Chart type settings tab on admin dashboard
- Changed: CSS Styles on admin dashboard
1.2.5
- Added: Pie chart slice text option
1.2.4
- Added: Pie chart tooltip text option
- Changed: CSS Styles on admin dashboard
1.2.3
- Added: Pie chart reverse categories option
- Fixed: CSS Styles on admin dashboard
- Fixed: PHP issue on admin dashboard
1.2.2
- Fixed: CSS Styles on admin dashboard
- Updated: POT file
1.2.1
- Added: Legend Font Color option
- Fixed: JS issues on admin dashboard
1.2.0
- Added: Chart description font color option
- Added: Chart description font size option
1.1.9
- Added: Delete column functionality
- Added: Chart title font size option
- Fixed: CSS Styles on admin dashboard
1.1.8
- Added: Integration with Quiz Maker plugin
1.1.7
- Added: Line chart type
1.1.6
- Added: Bar and Column charts is stacked option
- Changed: CSS Styles on admin dashboard
1.1.5
- Added: Bar and Column chart focus target option
- Added: Confirmation for delete actions
1.1.4
- Added: Pie Chart slice border color option
1.1.3
- Added: Pie chart rotation degree option
- Fixed: JS issue on admin dashboard
1.1.2
- Added: Shortcode text for editor for chart
- Fixed: Tooltip display issues on admin dashboard
1.1.1
- Added: Titles for chart data
- Fixed: CSS Styles on admin dashboard
1.1.0
- Added: Bulk delete action
1.0.9
- Added: Legend alignment option
1.0.8
- Added: Except words count in list table option
- Fixed: CSS styles on admin dashboard
1.0.7
- Added: Add column option for Column and Bar chart types
- Changed: CSS Styles on admin page
1.0.6
- Added: Elementor widget
- Fixed: CSS styles on admin and front pages
1.0.5
- Added: Gutenberg editor widget
- Added: How to use page
1.0.4
- Changed: CSS Styles on admin page
1.0.3
- Added: Legend position option
- Fixed: CSS Style issues on admin dashboard
1.0.2
- Added: Chart Description option
1.0.1
- Fixed: CSS Style issue on admin page
1.0.0
- Relaesed