

外掛說明
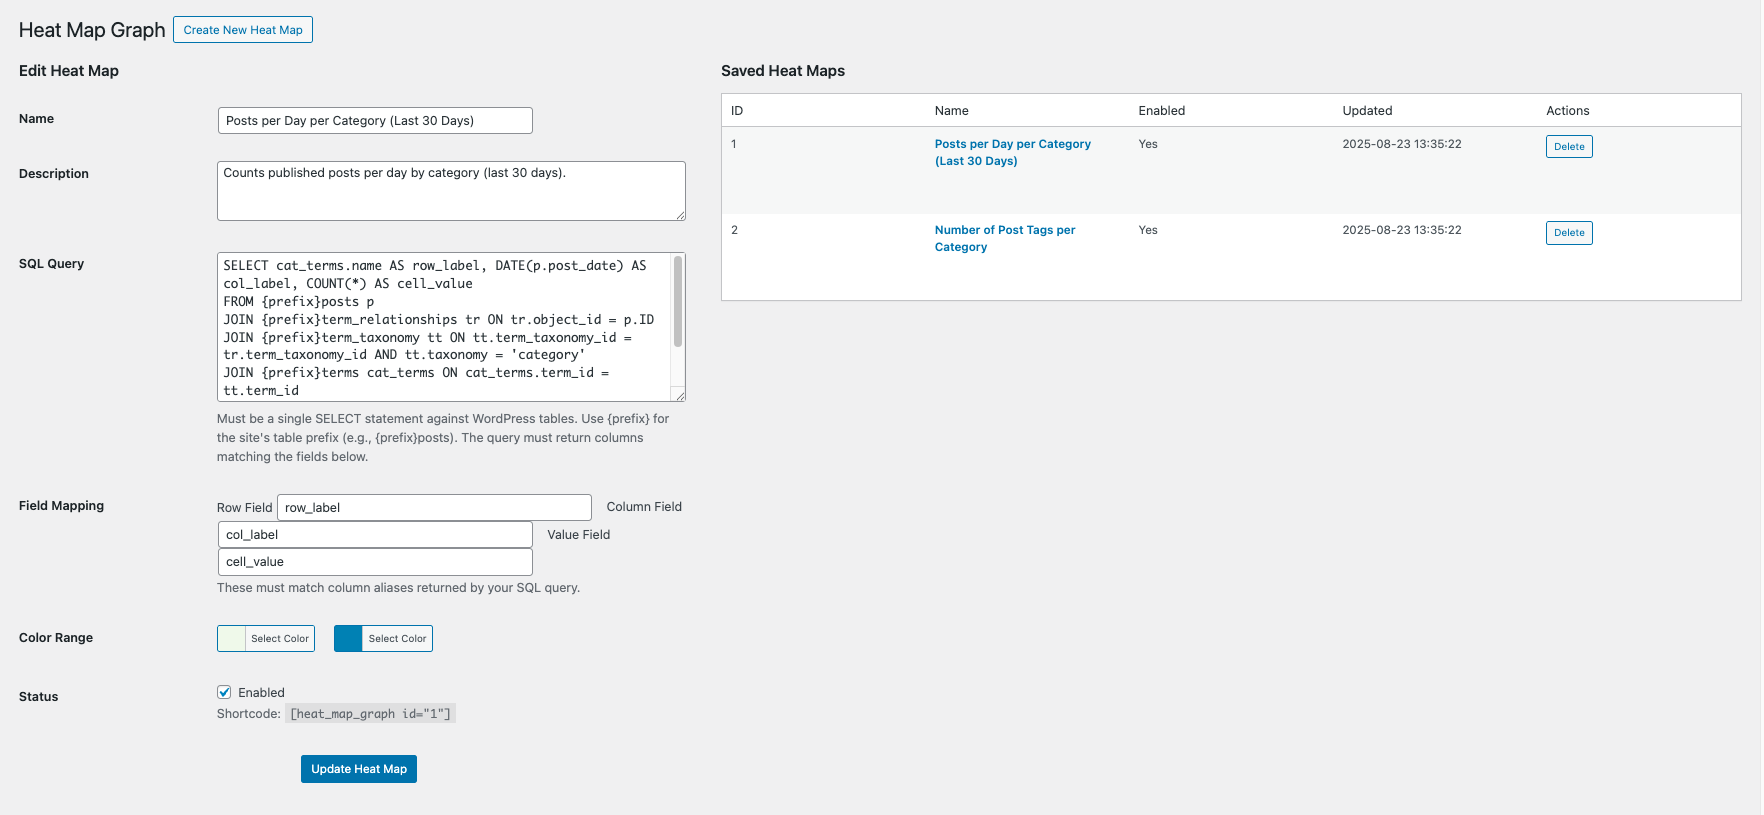
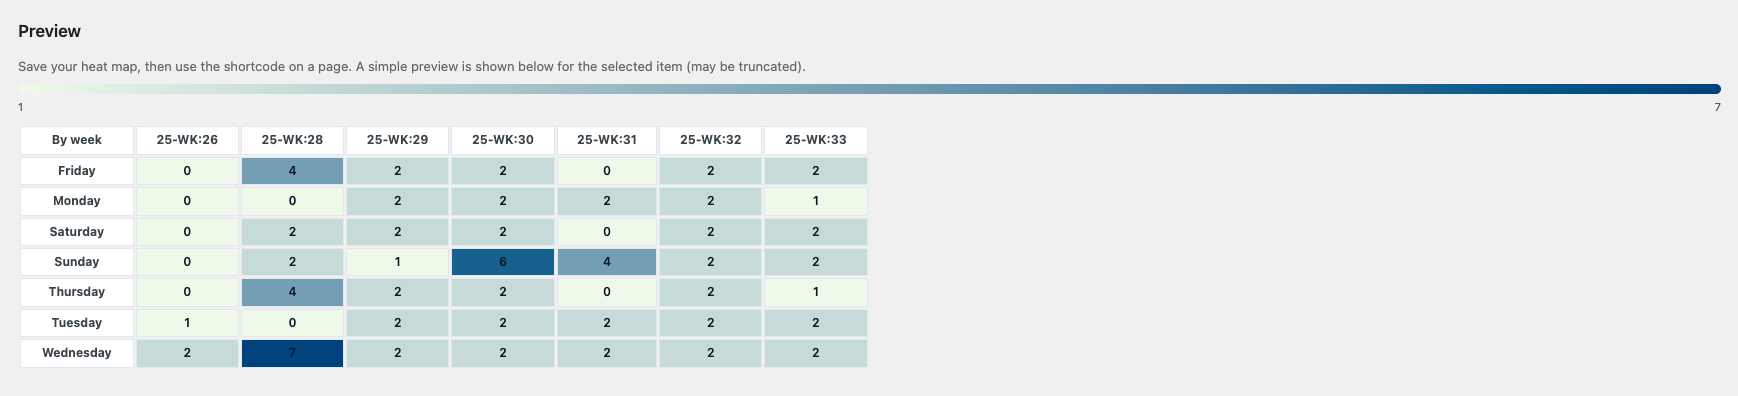
Heat Map Graph lets administrators build data heat maps backed by SQL SELECT queries on WordPress tables. Configure:
- Query: a single SELECT statement targeting WP tables
- Field mapping: row, column, and value fields produced by the query
- Color range: hex colors for min and max
- Status: enable/disable
Use the shortcode on pages/posts:
[heat_map_graph id="123"]
Security features:
– Validates SQL is a single SELECT against WP tables only
– Blocks DML/DDL keywords
– No multiple statements
– Admin-only UI with nonces and strict sanitization
On activation, two sample heat maps are created:
– Posts per Day per Category (Last 30 Days)
– Number of Post Tags per Category
螢幕擷圖
安裝方式
- Upload the plugin folder
heat-map-graphto/wp-content/plugins/ - Activate the plugin
- Under Heat Map Graph in the admin menu, create a heat map or use samples
- Place the shortcode
[heat_map_graph id="<ID>"]where you want the heat map
常見問題集
-
Which tables can I query?
-
Only WordPress core tables, prefixed by your site’s
$wpdb->prefix. -
Can I pass parameters?
-
Use static queries or views; dynamic user input is not supported for security.
使用者評論
這個外掛目前沒有任何使用者評論。
參與者及開發者

變更記錄
1.0.0
- Initial release