外掛說明
Chartplot is a wordpress chart plugin that allows you to create charts and embed them into your posts and pages.
Some of the features chartplot provides:
- Live editor with intuitive controls
- No programming knowledge required
- 8 series types to choose from, e.g. line, area or candlestick
- Combine multiple series in one chart to create complex visualizations
- Themes and hundreds of customization options to fit your needs
- Responsive charts that look great on desktop, tablet or mobile
- Based on highly popular ECharts
Documentation
Please visit our ChartplotDocs.
Feedback
We strive to improve our products and we rely on feedback from you.
Please feel free to share any feedback by sending an email to support@chartplot.com.
螢幕擷圖

Overview of all your charts. 
Select the type of chart you want to create. 
Chart editor, showing the y-axis settings. 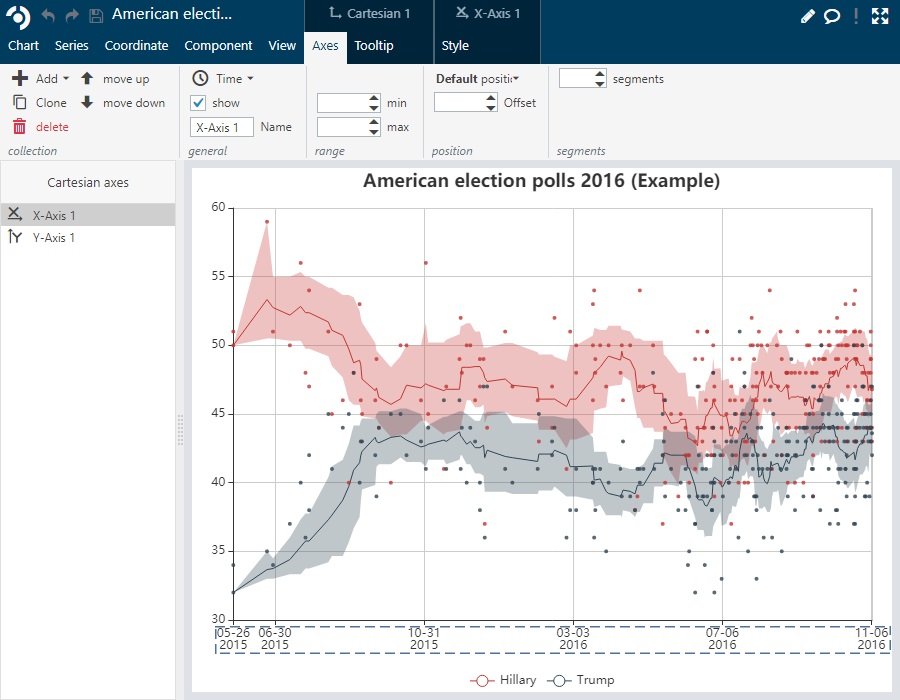
Maximized chart editor, showing the x-axis settings. 
Add shortcode using the chartplot button in the classical editor. 
Chartplot block in the gutenberg editor. 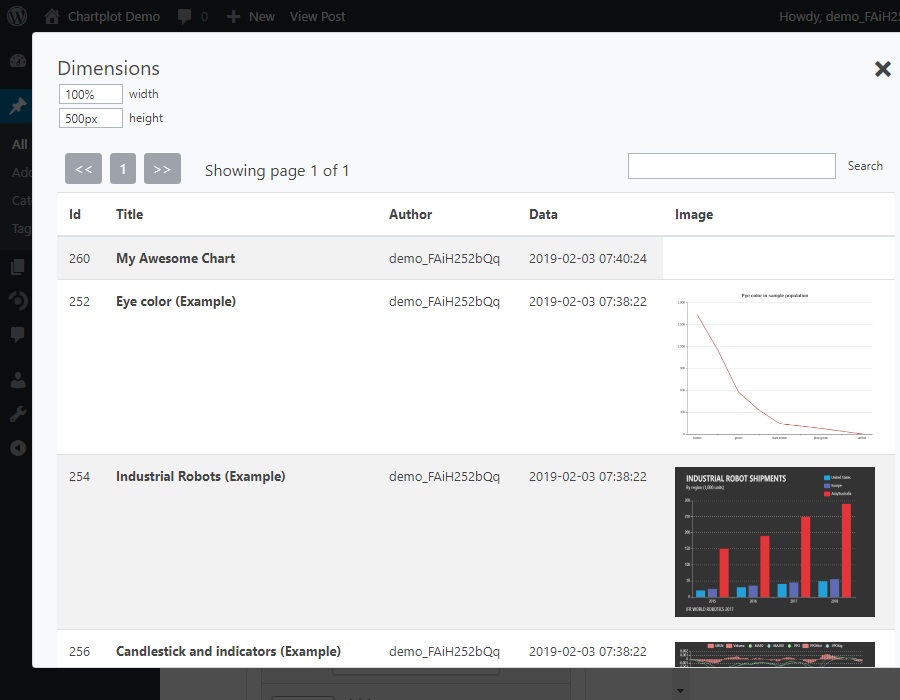
Chart selection for both classical and gutenberg editor.
使用者評論
這個外掛目前沒有任何使用者評論。
參與者及開發者
變更記錄
1.0.0
- First published version